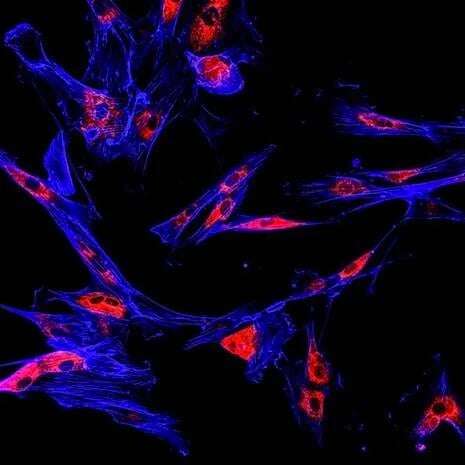
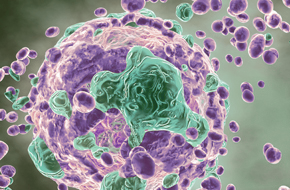
Leverage our unrivalled collection of PDX models, derived directly from patient tumors to reflect the heterogeneity and diversity of the human patient population.
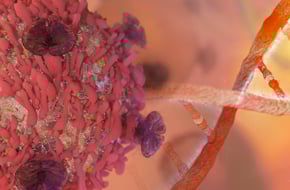
Make key decisions in a timely and cost-effective manner about the progression of your preclinical development program with cell line-derived xenograft (CDX) models.

Discover homografts derived from immortalized mouse cancer cell lines with fully competent immunity for assessing single agent and combination immunotherapies.
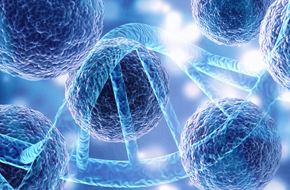
Harness the human immune system against human tumors with human hematopoietic stem cell (HSC) engraftment of patient-derived xenograft models.
Explore a simple alternative to the full stem cell reconstitution approach that allows you to evaluate your immunotherapy within a human tumor microenvironment.
Discover immunocompetent chimeric mouse models, engineered to express humanized drug targets such as genes encoding for immune checkpoint proteins.
Combine the predictive power of GEMM with an improved operational simplicity, consistency, and growth, similar to syngeneic models for your pharmacological research.