- Services
- Therapeutic Areas
- Model Systems
- In Vitro
- In Vivo
- Technologies
- Service Type
- About Us
- Our Science
- Start Your Study Now
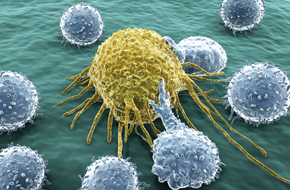
At Crown Bioscience, we are driven by our mission to ensure that every patient gets the right treatment at the right time. That is why we are trusted by the world’s leading biopharmaceutical companies to advance their preclinical and translational research programs. With our extensive experience in the areas of oncology and immuno-oncology. Leverage the infinite possibilities of scientific innovation.
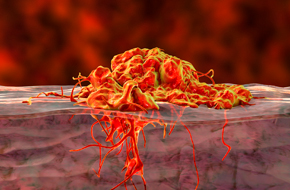
Accelerate your oncology program using our comprehensive suite of in vivo, in vitro and ex vivo biological services
Explore a unique collection of ex-vivo patient tissue, validated syngeneic, mouse tumor homograft models, and humanized genetically engineered mouse models.
![]()
© 2024 Crown Bioscience. All Rights Reserved.
![]()
![]()
© 2024 Crown Bioscience. All Rights Reserved. Privacy Policy

2024-01-29
2023-01-23